Bulletin, September 2008
The Latest in Area Economic and Technical Trends
Exclusively to Clients and Friends of Advanced Practice Management
The Dental Dow Jones
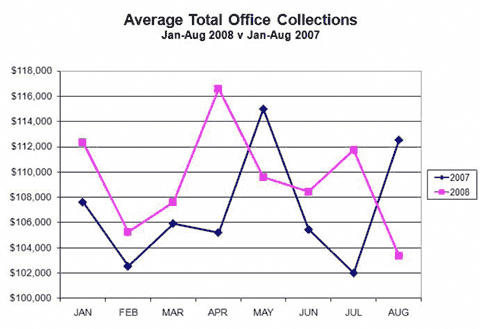
The 35 mature practices sampled showed production up 3% and collections up 2.6% compared to January through August of 2007.
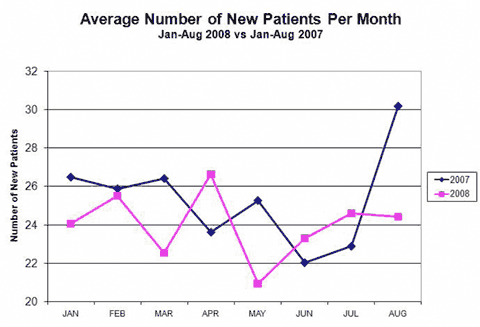
Down time in the Doctors’ schedule is up 22% from an average of about 11.4 hours to 13.9 hours per office per month. Hygiene down time is up about 4%. New patients are down 4.6%.
Patient flow as measured by exams is about even with last year (just up .6%), crown and bridge is down 1.8%. The overall production per exam (which is a function of fees, crown and bridge and other procedures delivered) is up 3.3%.
Delta Audits (again!)
After a relatively quiet 2007, Delta audits seem to be picking up a bit. They are still a relatively rare event. Based on our experience and the MDA’s, we estimate there have been about 20 in Minnesota so far this year.
If Delta calls wanting a 1 or 2 hour visit on site, it probably is for a “fee verification.” No big deal and not what I’m referring to.
More problematic is when they request specific charts. In those situations, the dentists were asked to give money back after the audit. The amounts ranged from as little as $900 to well over $100,000. Most “chargebacks” seem to be in the $20,000-$30,000 range.
What are your best defenses?
- Code exactly what you did according to the current CDT book. Do not play games with codes or the dating of procedures.For example, I know of at least two of these audits were on practices that were postdating panoramic x-rays by a day in order to get coverage (on the pano and the bite wings). Bad idea.
- Make sure your recordkeeping is solid. If you did a composite and the radiographs do not show the decay into the dentin, make sure that you note it in the chart.The MDA knows of at least one case where an audited Doctor had flawless recordkeeping. In that situation, Delta could not prove any substantial utilization or coding problems. (That’s the Doctor that only had to pay back $900).
If you are audited, let me know and contact Loren Hanson at the MDA. We can refer you to legal counsel that is experienced in dealing with Delta and can help soften the blow.
Has it been a while since you’ve reviewed your coding and recordkeeping procedureswith your staff? Shelly Ryan is able to help you with this. Just call 952 921 3360 and we’ll get you taken care of.
A feast for the bread and butter dentist:
Dr. Joe Steven is coming to town! Many of you are familiar with Joe and like his practical, down-to-earth approach.
I’ve made special arrangements with Dr. Steven for our APM clients. Just mention you’re an APM client and you’ll receive $50 off per Doctor and $15 off per staff person at his upcoming seminars this fall.
Call Joe at 800-325-8649 now and get this date marked on your calendar…October 31.
How does your income stack up?
These statistics are from the most recent ADA report which is based on data from 2005. The physicians’ data is from 2006. (Source: Medical Economics, August 2008)
Dentists Annual Net Income
General dentists of all ages, average payÑ $200,210 per year.
Dentists Annual Net IncomeGeneral dentists of all ages, average payÑ $200,210 per year. |
||
Compared to Physicians’ payAll primary care physicians, average pay- $165,000 per year |
||
Yes, there is lots of uncertainty. We’ll keep you up on what’s happening with the local Dental economy. In the meantime, plan on succeeding and leverage your and your staff’s time and talents with sound management.
Sincerely,


